Controlled User Study Sub-Report
Table of Content
2 Summary of Experiment Design
1 Overview
Since this type of photo album is completely new, we need to test several features with users to ensure that the features are efficient to use and that the users are satisfied with the features.
First we will have the user perform searching tasks under two different organization schemes for the photos in the album. The task will consist of an image content oriented search where the user needs to locate a photo given a description of its content. We will be timing the performance of the users on both searches.
Our second major tests will focus around the preference between utilizing gestures or buttons for navigation during the user��s browsing experience. We will be testing to ensure gestures at a minimum do not slow down the user��s ability to browse through the album. The times for browsing through the album using gestures will be compared to that using on screen buttons.
The third test will be focused on timing how long it will take users to add photos to an album from our calendar view. We will be examining how much time users take to add a set of photos to an album using our one touch add function, where a user selects a batch of photos at a time and add them all to an album using a single button action. This method will be compared to the drag and drop adding style for each individual photo.
2 Summary of Experiment Design
2.1 Hypothesis
2.1.1 Null Hypothesis
Search Photo Test �V where two
organization schemes are compared for the searching task
H10: The user will not take less time to search for a specific photo when the photos are categorized into the year, month, and week views.
H20: The user will make more than the minimum number mouse clicks to find a photo in the album when using a ��Year-Month-Date�� arrangement.
Browse Photo Test �V where gesture is
compared to the button
H30: The user will use gestures less frequently than they will use the next/previous buttons to navigate through the photos.
H40: The user will take more time to navigate through the photos with gestures than with the next/previous buttons.
Add Photo to Album Test �V where two interaction methods of adding photos are compared
H50: The user will take more
time to add 5 out of 15 photos to an album using the one touch add function
than it is to use the drag and drop style.
2.1.2 Hypothesis
Search Photo Test �V where two
organization schemes are compared for the searching task
H1: The user will take less time to search for a specific photo when the photos are categorized into the year, month, and week views.
H2: The user will make the minimum number mouse clicks to find a photo in the album when using a ��Year-Month-Date�� arrangement. (i.e. for our prototype, that would be 8 clicks assuming a linear search of the summer months of June, July, and August).
Browse Photo Test �V where gesture is
compared to the button
H3: The user will use gesture more frequently than they use the next/previous buttons to navigate through the photos.
H4: The user will take less time to navigate through the photos with gestures than with the next/previous buttons.
Add Photo to Album Test �V where two interaction methods of adding photos are compared
H5: The user will take less time to add 5
out of 15 photos to an album using the one touch add function than it is to use
the drag and drop style.
2.2 Independent Variables
1. For the tests where a task is being timed, there are no IVs.
2. For the tests where the gesture is compared to the button for the navigation, the IV for these tests is the input method (Gesture vs. Buttons).
3. For the tests where two different methods of achieving the same goal are being compared, the IV for these tests is the interaction method (e.g. One touch batch add vs. Single photo drag and drop).
2.3 Dependant Variables
1. For the tests where a task is being timed, the DV is the time for the user to complete the task.
2. For the comparison tests, the DVs are a) the time to complete the task and b) user preference.
2.4 Task List
Search Photo Test �V where two
organization schemes are compared for the searching task
1) The user is instructed that the
picture they are looking for is one in which a white truck is parked in front of
a church. Find that photo by
traversing linearly through the entire photo collection until the photo is
found.
2) The user is told that a picture
they are looking for resides in the summer of 2001, as well as the descriptions
that they are looking for a picture of a white parrot behind a cage. Find that photo by navigating through
the year, month, and week views until the photo is found.
Browse Photo Test �V where gesture is
compared to the button
3) In the fullscreen
mode, browse the photo at your discretion. For each photo describe its content
to the person executing the test.
4) Users are told to look for a
picture of Hammond Park Gate using gestures. The time for task completion is
recorded.
5) Users are told to look for a picture
of a peacock being fed using the next/prev.
buttons. The time for task
completion is recorded.
Add Photo to Album Test �V where two interaction methods of adding photos are compared
6) Add 5 photos to an album with the
one touch add function. Photos to
be added are in colour while others are in gray
scale. Select a photo by clicking
on it. After all 5 photos have been
selected, click the add button.
7) Add 5 photos to an album with the
drag and drop feature. Drag and
drop each coloured photo to the album icon.
2.5 Prototype
To emphasize the real idea and physical shape of the digital photo album a silver-color wooden prototype was produced. The prototype accepts the printed screen shots of the real digital photo album environment. The user can hold it in his/her hands to gain some ideas about the physical shape and dimensions of the device.
The software prototype of the digital photo album was implemented in Macromedia Flash based on its strong functionality and features. The original goal was to run the movies on a touch screen LCD monitor that had similar size and weight as the wooden prototype. Unfortunately technical hardware problems with the serial interface of the system and the lack of time prevented us from utilizing this more representative interaction method for testing. The Flash experiments all were executed on a normal laptop with a mouse and touch pad.
2.6 Experiment Design issues
During the test and prototype design there were some issues that made the experiment less valid:
�P Not all the tasks and actions that we ask the user to do may happen in the real life
�P In a real test of the digital photo album, the user would be familiar with the pictures that they were dealing with. In the test though, the pictures presented were seen by the user only for the first time when they performed their tasks. This made the tests less externally valid.
�P We did not have a huge variety of pictures to examine the real user��s functionality and performance
�P The actual digital photo album prototype should have been running on a touch-screen LCD monitor, but because of hardware problems the day before the test we were unable to run our various prototypes on the real platform. Some of our tasks were not done to the degree of realism that we would have preferred. (e.g. The gesture movement that the user had perform with the mouse instead of the hand)
�P The testers were all computer and electrical engineering students and as such were much more experienced than the average user in terms of computer skills. Their testing results will likely not be a good representative indication of the true means taken from a population sample.
�P The small number of sample population was another important limitation, as it restricted the variation and randomness of our subjects.
�P In hindsight, some of our tests were unknowingly biased towards steering the user to one result. The specific one that comes to mind involved the one where we observed the user��s preference for the gesture or the button by asking them to freely browse the album. Most users went with the buttons as there were clear visual affordances to using the button. The lack of an on screen ��presence�� for the gesture function put it at a disadvantage. A small label to indicate the existence of gesture would have helped in this case.
2.7 Data Collection
Four Macromedia Flash movies were designed for the three main parts of the digital photo album which are: Browsing, Searching and adding.
For the ��Add section��, two different Flash movie tests based on two different designs (drag & drop and selected & one touch add) were designed.
For the browsing task the two different designs (with hand gesture and buttons) were integrated into one Flash movie to allow the subjects to deal with both in same place. The data (time and number of clicks) was recorded in data collection form for each subject.
The tests took place in the computer lab located in ECE. Two team members were responsible for both the timing and counting the number of clicks for each subject. Before starting the test, and thorough explanations about the goals and tasks were given to the users.
Each test approximately took 10-12 minutes per each subject.
At the end, all of the collected data were fed to a Matlab program and with the results outputted as graphs were in the following section under statistical analysis results.
Results:
The raw
data collected:
Browse |
Task 1 |
Search
for picture of |
|
Task 2 |
Search for picture of blue peacock feeding using button |
|
Search |
Task 3 |
Search for picture of white parrot behind a cage using Year Month Date (YMD) in summer |
|
Task 4 |
Search for picture of a church with a white truck in front using linear scroll |
|
Add |
Task 5 |
Adds pictures using the select and one touch add |
|
Task 6 |
Add pictures using drag and drop |
Table 1. Description of each task to obtain testing results
|
|
Task 1 |
Task 2 |
Task 3 |
Task 4 |
Task 5 |
Task 6 |
|
User 1 |
20 |
12 |
11 |
10.5 |
12 |
18 |
|
User 2 |
6 |
13 |
9 |
14.5 |
12 |
10 |
|
User 3 |
21 |
18 |
21 |
24 |
62 |
9 |
|
User 4 |
4 |
6 |
4 |
19 |
9 |
4 |
|
User 5 |
7 |
6.5 |
5.6 |
9 |
12 |
12 |
|
User 6 |
11 |
8 |
17 |
6 |
9 |
10 |
Table 2. Task time in seconds for each user
|
Number of usage
Users |
Gesture |
Mouse |
||
|
User 1 |
1 |
21 |
||
|
User 2 |
0 |
23 |
||
|
User 3 |
0 |
22 |
||
|
User 4 |
0 |
22 |
||
|
User 5 |
4 |
18 |
||
|
Table 3. Results from
asking users to browse trough all the photos and offer a short sentence
description |
0 |
22 |
|
Users |
Number
of clicks |
|
User 1 |
8 |
|
User 2 |
8 |
|
User 3 |
7 |
|
User 4 |
6 |
|
User 5 |
32 |
|
User 6 |
4 |
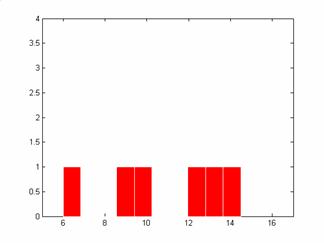
Table 4. Number of clicks while using YMD in the search task
|
Users |
Selecting with one touch |
Clicks with drag |
|
User 1 |
1 |
0 |
|
User 2 |
0 |
0 |
|
User 3 |
0 |
2 |
|
User 4 |
1 |
0 |
|
User 5 |
0 |
0 |
|
User 6 |
0 |
4 |
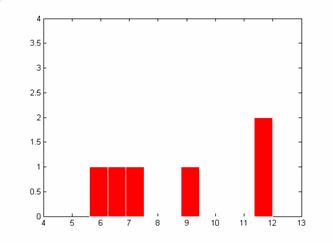
Table 5. Number of mistakes in the add task
Comparison of two samples
The basic t-test on two samples:
Here we do a t-test to compare two samples from two different designs of
browsing task in the digital photo album, the first design uses the hand
gesture to do the browse task and the second design uses the ��next�� and
��previous�� buttons:
Task1_d1 = [20 12 11 10.5 12 18]
Task2_d2 = [6 13 9 14.5 12 10]
Combined variance = 3.57
Standard error of difference = 2.06
t = 1.53
DOF = 10
Critical value of t = 2.228
Another t-test is done for different designs of photo adding in digital
photo album. Here the first design involves adding the pictures using the
select and one touch add and the second design involves adding pictures using
drag and drop.
Task5_d1 = [7 6.5 5.6 9 12 12]
Task6_d2 = [11 8 17 6 9 10]
Combined variance = 3.31
Standard error of difference = 1.91
t = 0.77
DOF = 10
Critical value of t = 2.228
T-test for paired comparison

Summary of
Results for Task #1
Number of subjects:
6
Mean time:
13.91s
Sum of Squares of Differences: 81.20
Degrees of Freedom (N-1): 5
Standard Deviation: 4.03
Standard Error of Mean: 1.64
Critical Value of t: 2.228
95% Confidence Maximum: 17.54
95% Confidence Minimum: 10.25
Summary of
Results for Task #2
Number of subjects:
6
Mean time: 10.75 s
Sum of Squares of Differences: 46.87
Degrees of Freedom (N-1): 5
Standard Deviation: 3.06
Standard Error of Mean: 1.24
Critical Value of t: 2.228
95% Confidence Maximum: 13.5
95% Confidence Minimum: 7.99
 Summary of Results for
Task #3
Summary of Results for
Task #3
Number of subjects:
5
Mean time: 18.60s
Sum of Squares of Differences: 133.2
Degrees of Freedom (N-1): 4
Standard Deviation: 5.77
Standard Error of Mean: 2.35
Critical Value of t: 2.228
95% Confidence Maximum: 23.81
95% Confidence Minimum: 13.38

Summary of
Results for Task #4
Number of subjects:
6
Mean time: 7.66 s
Sum of Squares of Differences: 173.3
Degrees of Freedom (N-1): 5
Standard Deviation: 5.88
Standard Error of Mean: 2.40
Critical Value of t: 2.228
95% Confidence Maximum: 12.9
95% Confidence Minimum: 2.3
Summary of
Results for Task #5
Number of subjects:
6
Mean time: 8.68 s
Sum of Squares of Differences: 39.2
Degrees of Freedom (N-1): 5
Standard Deviation: 2.80
Standard Error of Mean: 1.14
Critical Value of t: 2.228
95% Confidence Maximum: 11.21
95% Confidence Minimum: 6.14
 Summary of Results for
Task #6
Summary of Results for
Task #6
Number of subjects:
6
Mean time: 10.16 s
Sum of Squares of Differences: 70.8
Degrees of Freedom (N-1): 5
Standard Deviation: 3.76
Standard Error of Mean: 1.53
Critical Value of t: 2.228
95% Confidence Maximum: 13.55
95% Confidence Minimum: 6.7
To carry out a good user experiments is difficult since users might sometimes be confused with the task; others might find some holes or tricks in the test setup such that the focus of the test is completely avoided.
First, we will discuss the two tasks that we have 95% confidence in, which are:
- YMD level search provides a much efficient way of searching e.g. decrease the number of mouse click
- One touch photo adding takes less time to add photos to album than the drag and drop version
The tests for YMD mouse click counting attempted to see whether users would end up doing more mouse-clicking while navigating the time hierarchy. From the test results we see that in contrary, users did less mouse-clicking than we expected because some of them jumped straight to the month with the target photo. Although this might be just by coincidence, we consider this is still representative since real users would have a much clearer idea of where their photos are, compared to our subjects who had not seen the photos before.
The fact that the one touch add function took less time to add photos to an album was not surprising. We would be negligent though if we did not mention that the test overlooked the ability to select all the desired photos and add them in one drag motion. The clear issue that should have been explored then is in fact whether our ��shop-as-you-go�� method where the user can select and add as they wish, produced less adding errors compared to the drag and drop style. The problems of drag and drop style include:
- Mistakenly selecting a wrong photo, resulting in a mass de-selection of all the correct ones;
- A selection of a large group of photos to be added might be difficult when they can not be shown in a single view without scrolling , etc.
A test that examined the error rate under a time pressure situation between these two cases should be performed.
On the other hand, regarding the rejected hypotheses, we see that some of our original assumptions might be incorrect, and there may be a need to improve some of our testing methodologies. The fact that users took longer time to search for photos using the YMD hierarchy can be attributed to the unfamiliarity of the user with the photos archive. We suspect that the extensive use of mouse clicking in the time navigation hierarchy took users longer time to search.
In the post-test analysis, we recognized the fact that gestures were almost completely unused compared to buttons in the browse test because users had no visual reminder/indication that gestures were available. Given the button was a visible artifact on the screen with a clear affordance (i.e. click to go to the next photo), users defaulted to its use compared to the equivalent gesture. Perhaps in future test we could provide an on screen reminder/indication that gestures are indeed available.
Finally, the gesture versus button speed
search task results in a mixed conclusion.
We could guess by intuition that gesture might be slower than buttons in
a head to head test. In regular usage where the user may want to track down a
photo, the button method will likely be preferred for its ease of use and rapid
action. The gesture though we feel
can benefit from future test to evaluate the ��comfort and intimacy�� factor
which users feel when browsing photos in a social setting, in comparison to the
use of buttons.
|
Accepted |
Rejected |
|
H2: The user will make the minimum number mouse clicks to find a photo in the album when using a ��Year-Month-Date�� arrangement. H5: The user will take less time to add 5
out of 15 photos to an album using the one touch add function than using the
drag and drop style. |
H1: The user will take less time to search for a specific photo when the photos are categorized into the year, month, and week views. H3: The user will use gesture more frequently than they use the next/previous buttons to navigate through photos. H4: The user will take less time to navigate through photos with gestures than with the next/previous buttons. |